Business Analytics • Conversion Modeling
Customer Purchase Prediction & Conversion Analytics
Predicting purchase likelihood from browsing behavior, visitor context, model evaluation, and threshold-tuned conversion targeting.
This project builds a purchase-propensity workflow for online shopping sessions. It combines exploratory conversion analysis, supervised classification, threshold optimization, and feature-importance interpretation to support business-focused targeting decisions.
Project Overview
This project analyzes online shopping sessions to predict purchase likelihood and support conversion targeting. The workflow combines exploratory customer behavior analysis, class-imbalance-aware modeling, model comparison, threshold tuning, and feature-importance interpretation to connect predictive performance with practical business decision-making.
Conversion Behavior
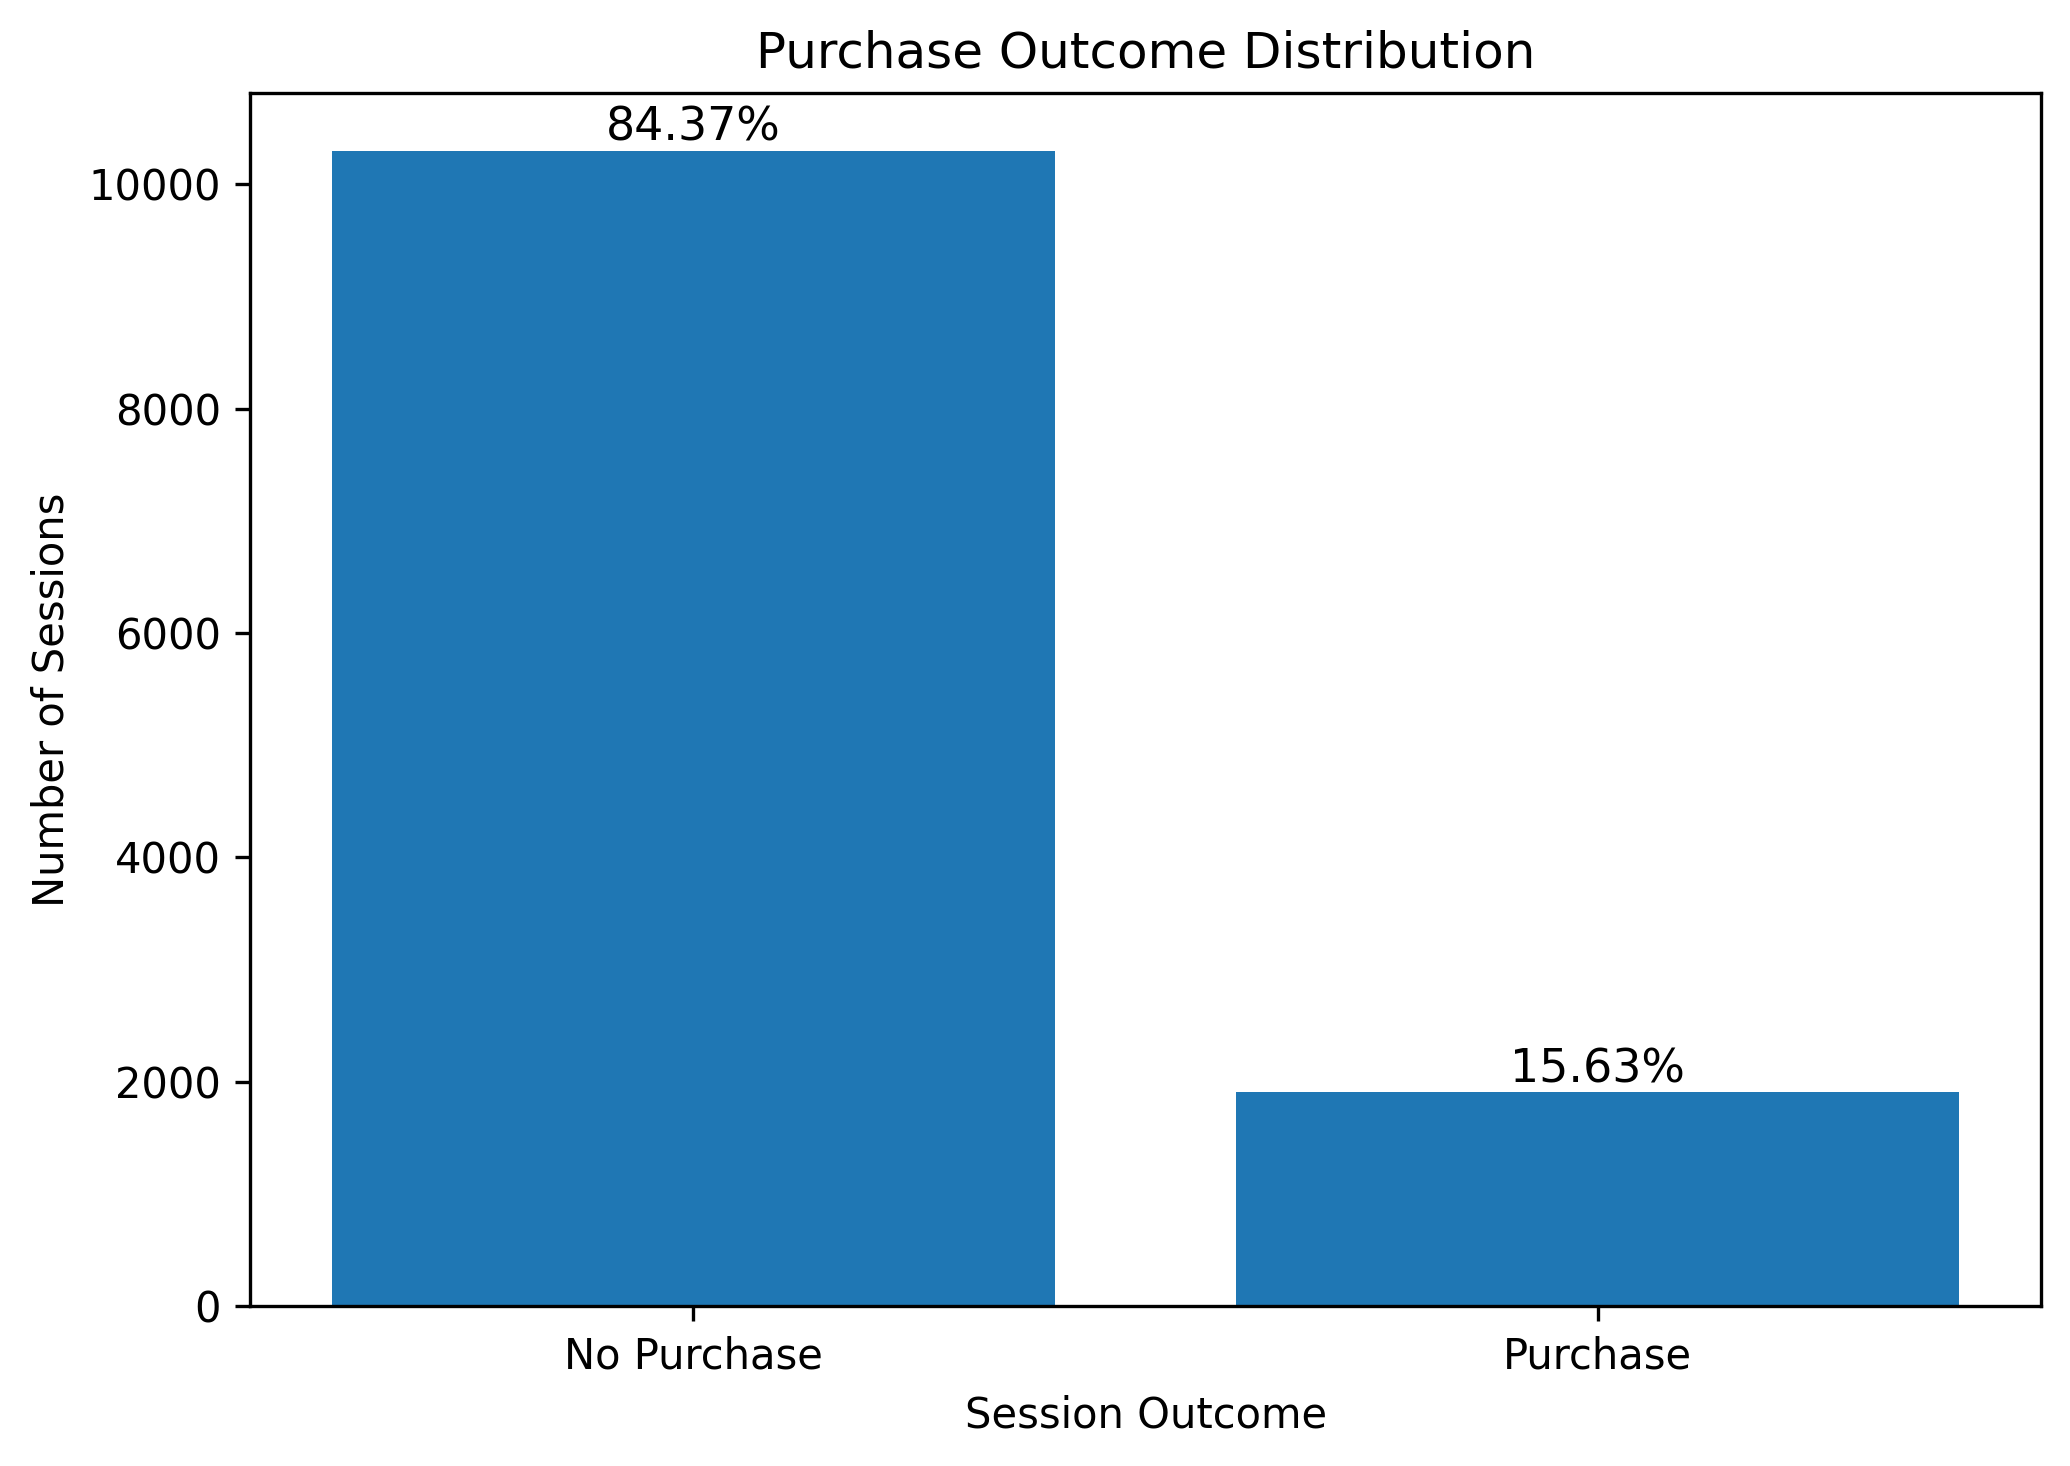
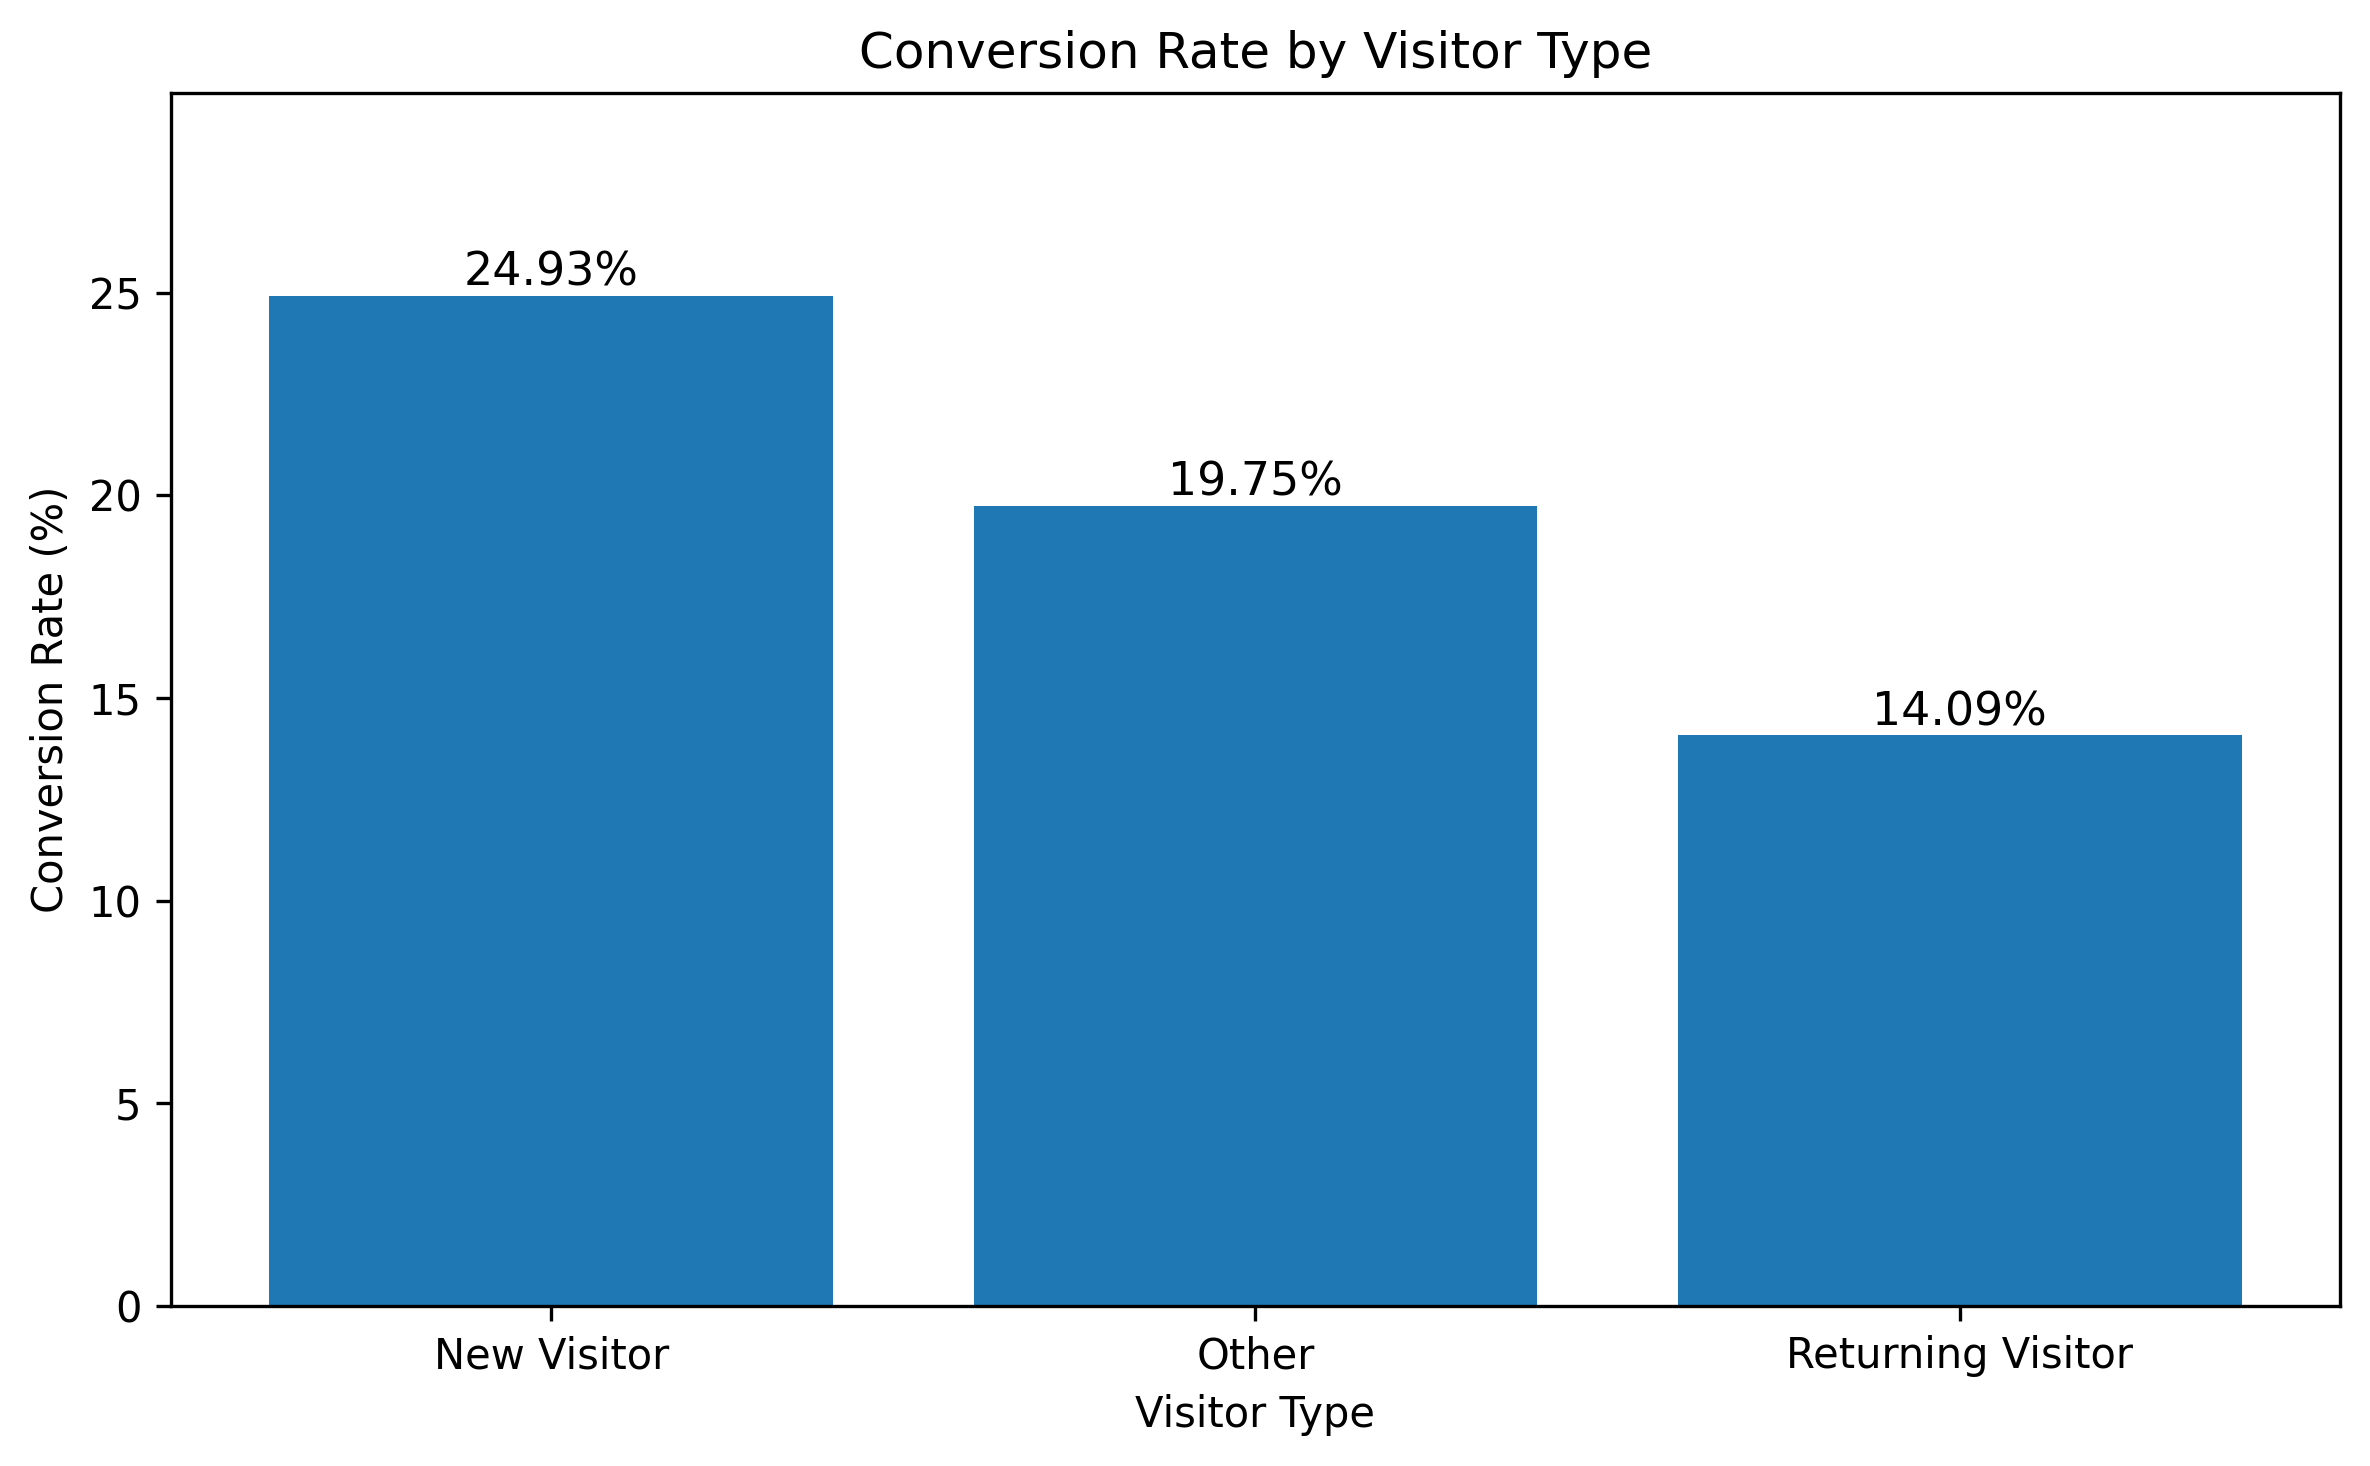
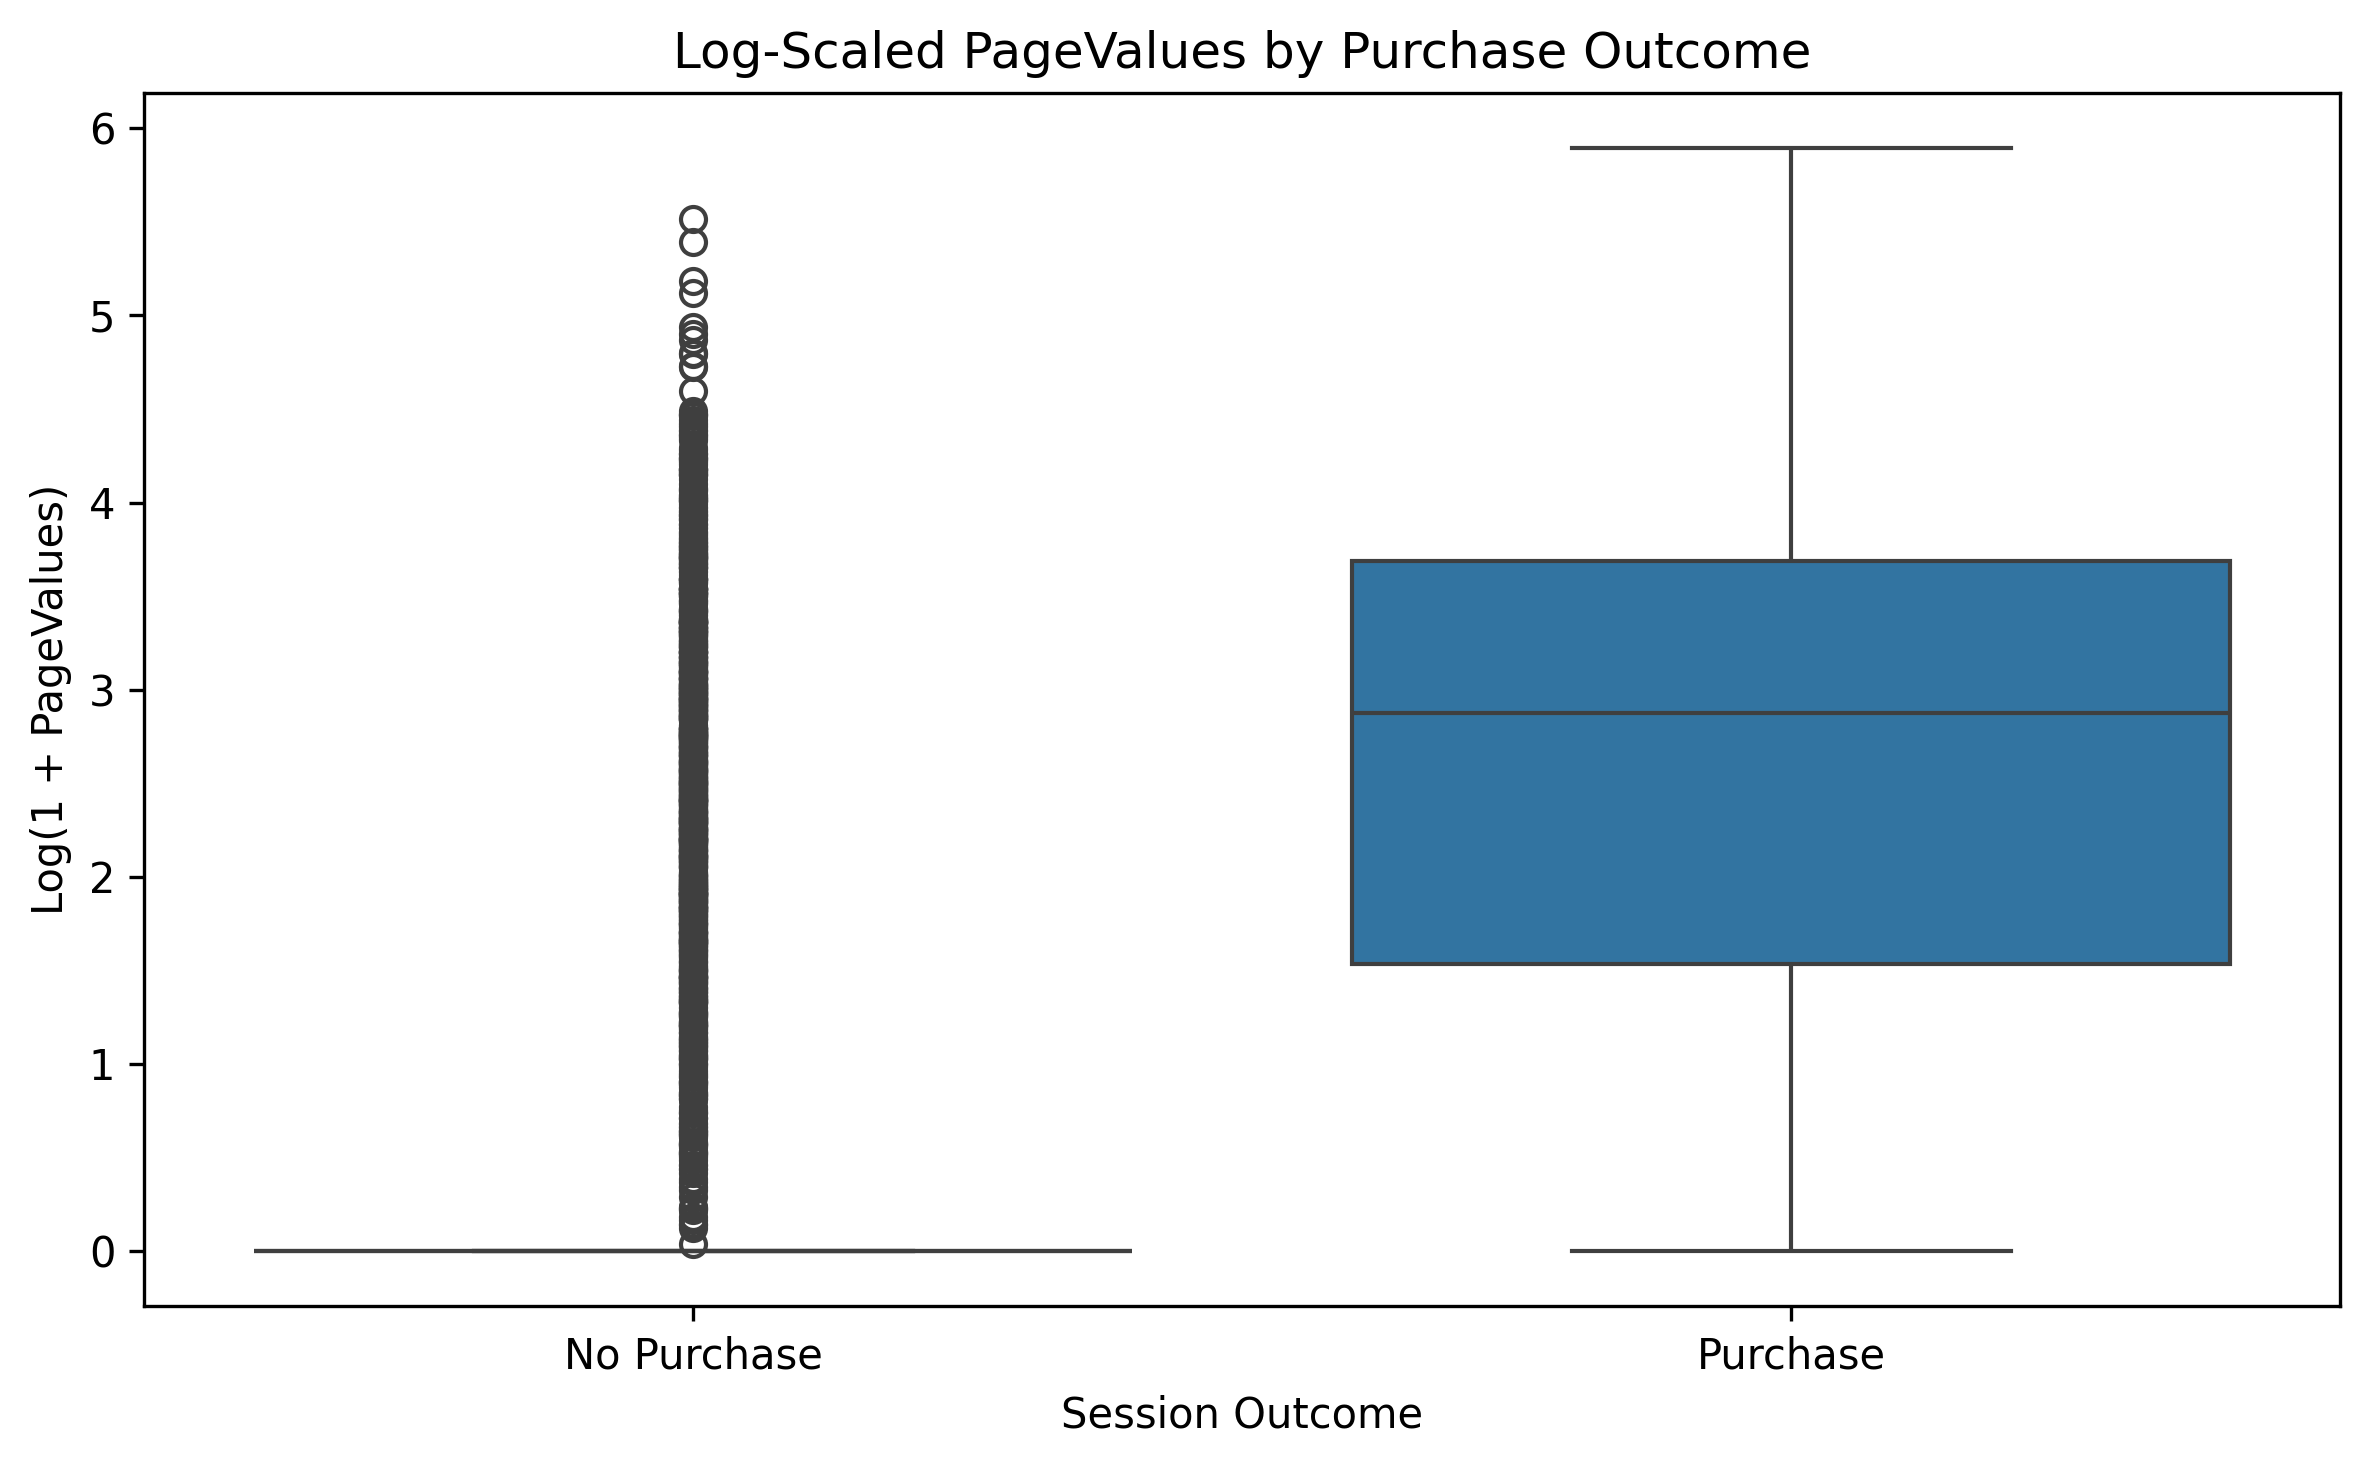
The dataset is highly business-oriented: Most online shopping sessions in the dataset do not result in a purchase, creating an imbalanced conversion problem. Before modeling, the project analyzes purchase distribution, visitor-type conversion rates, and behavioral value signals to understand which session patterns are associated with revenue.
Modeling Workflow
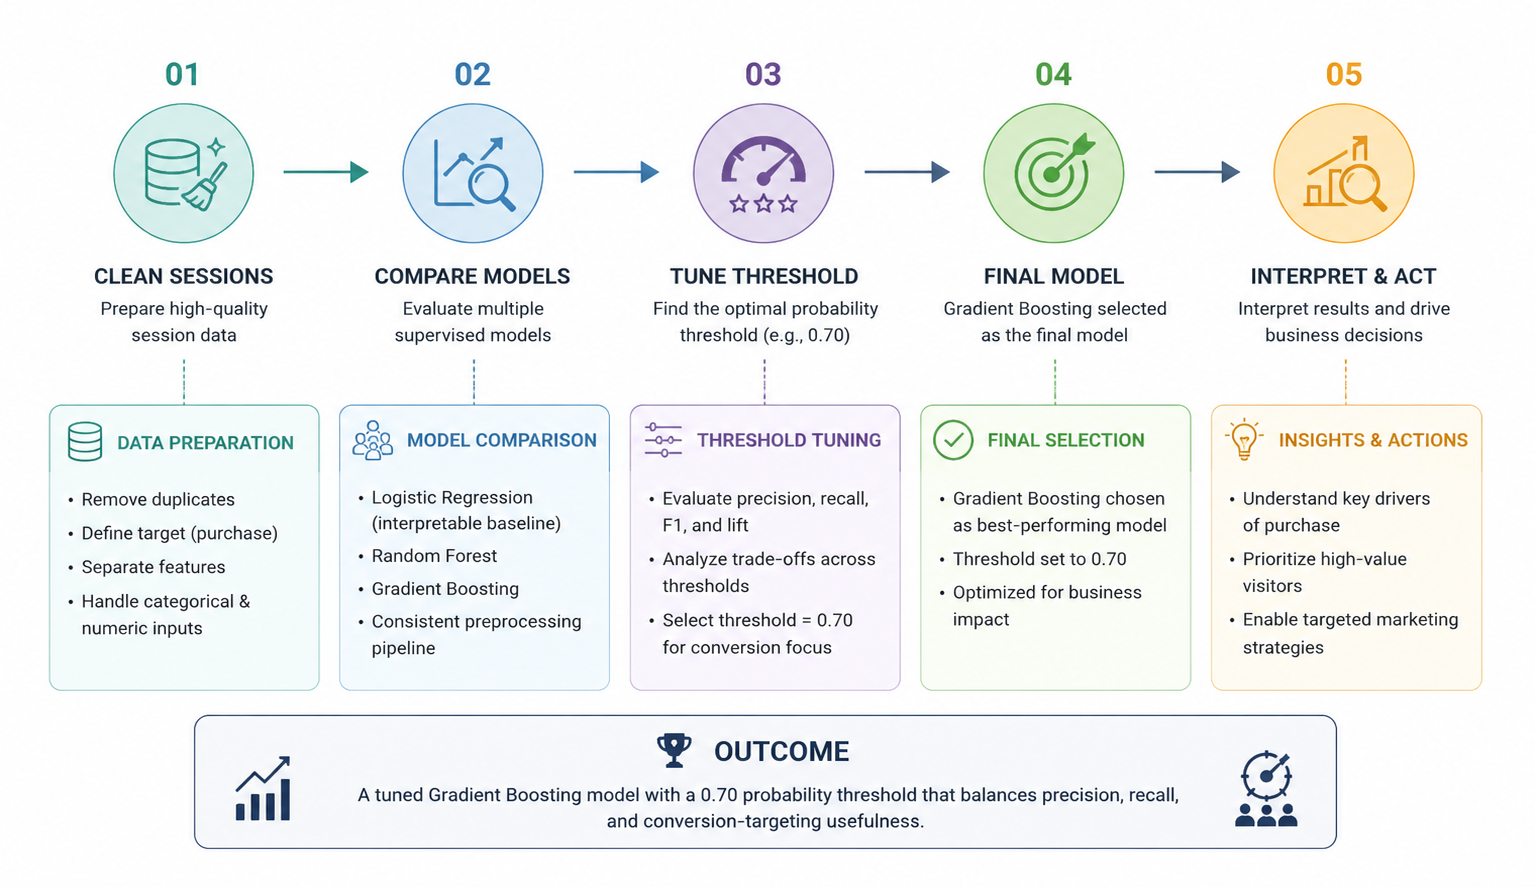
The notebook compares multiple supervised classification models and evaluates them using business-relevant metrics. The workflow progresses from cleaned session data and preprocessing through model comparison, threshold tuning, and final business-oriented evaluation of purchase-likelihood predictions.
Model Performance
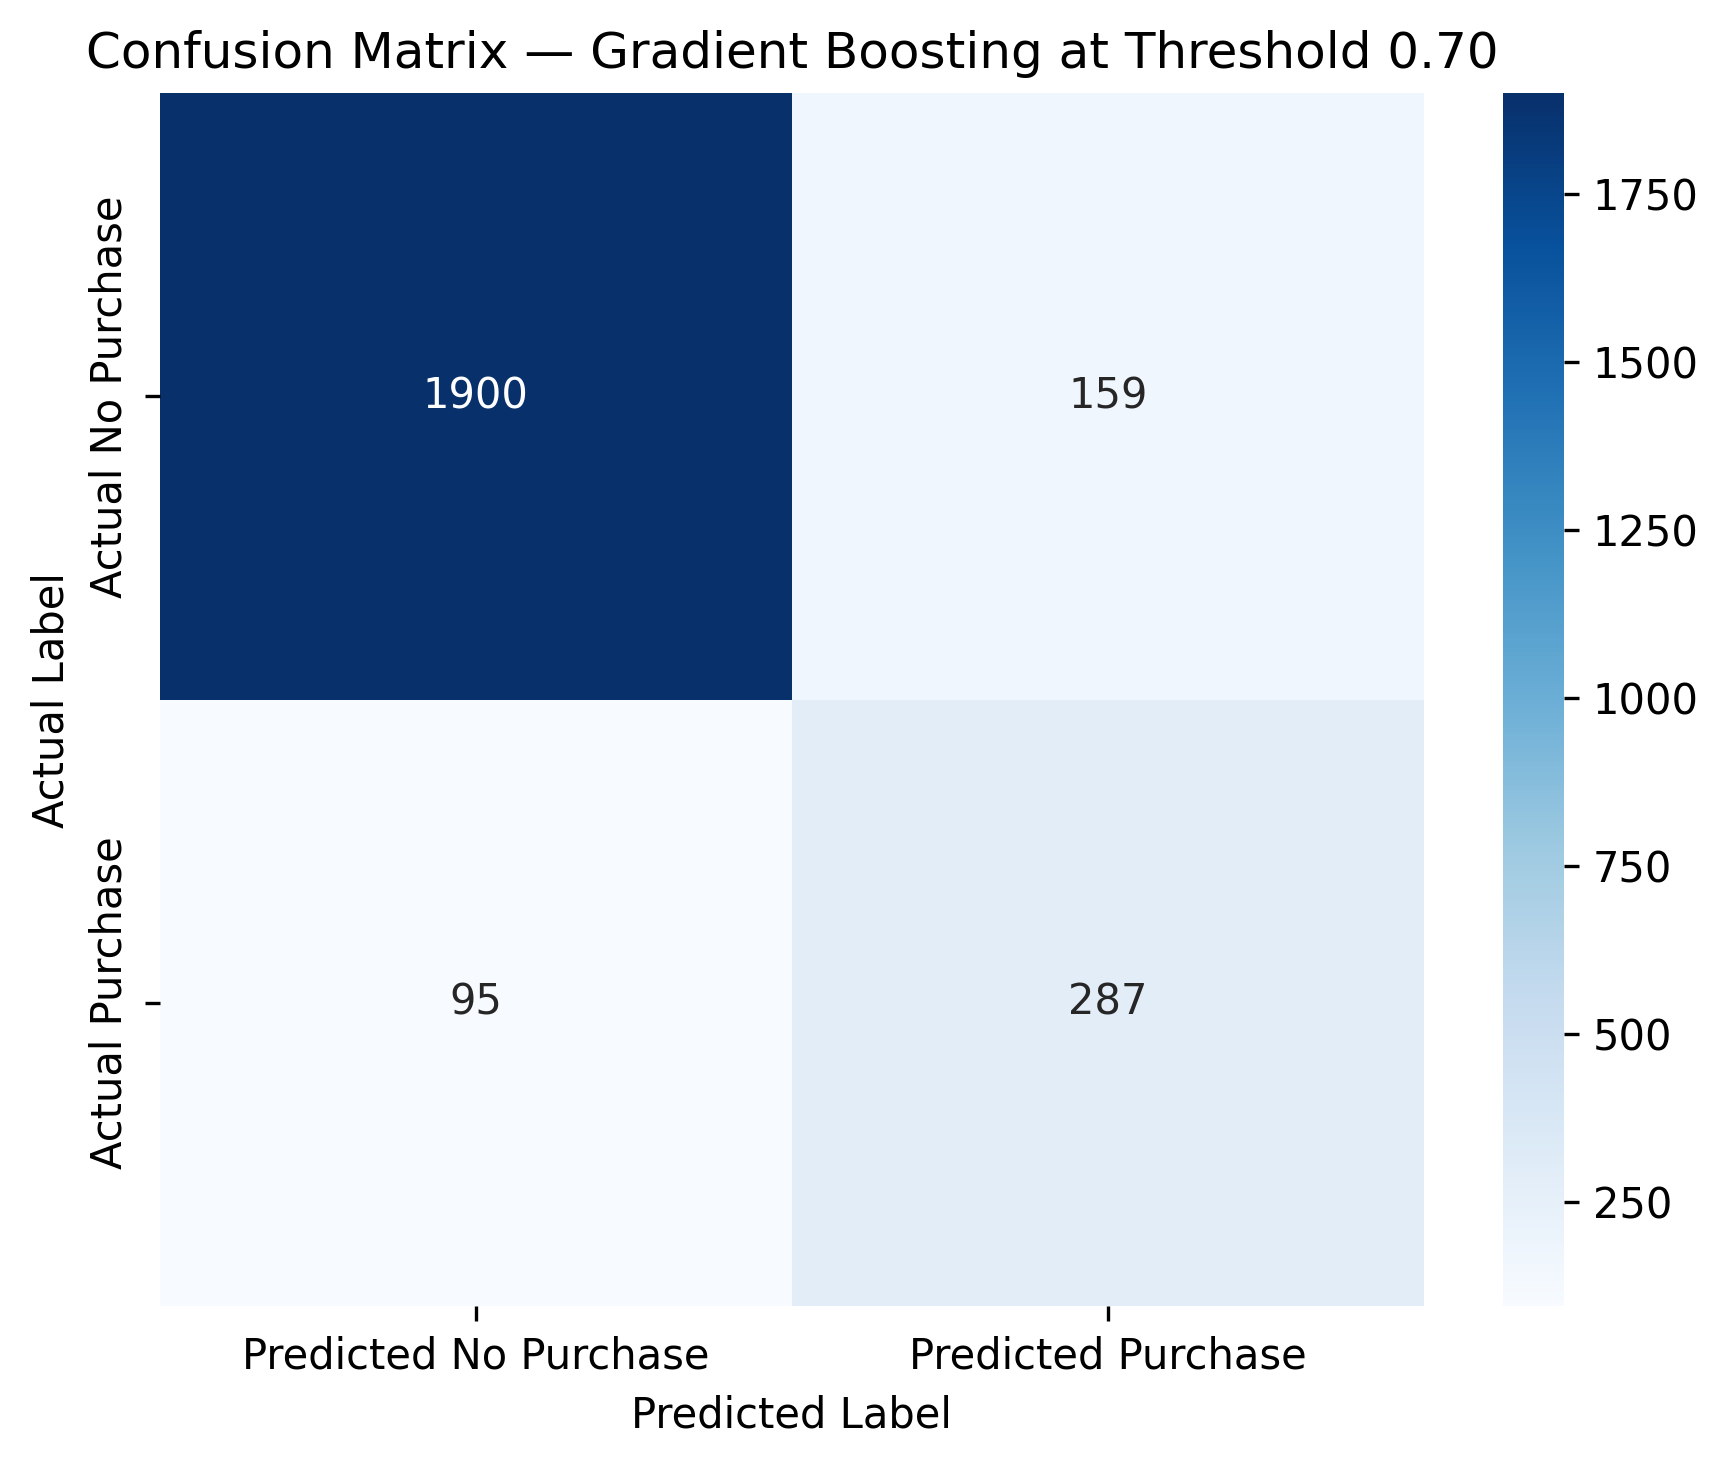
Gradient Boosting was selected as the final model because it delivered strong ranking performance and supported threshold-based targeting. At the selected threshold of 0.70, the model identifies a substantial share of purchase sessions while limiting unnecessary targeting of non-purchase sessions.
| Final model | Accuracy | Precision | Recall | F1-score | ROC-AUC |
|---|---|---|---|---|---|
| Gradient Boosting at threshold 0.70 | 89.59% | 64.35% | 75.13% | 0.6932 | 0.9377 |
Business Interpretation
The selected threshold balances identifying likely buyers with reducing unnecessary targeting of non-purchase sessions. In a business setting, this type of model could support campaign targeting, remarketing prioritization, or conversion-likelihood scoring rather than replacing human strategy.
Threshold Optimization
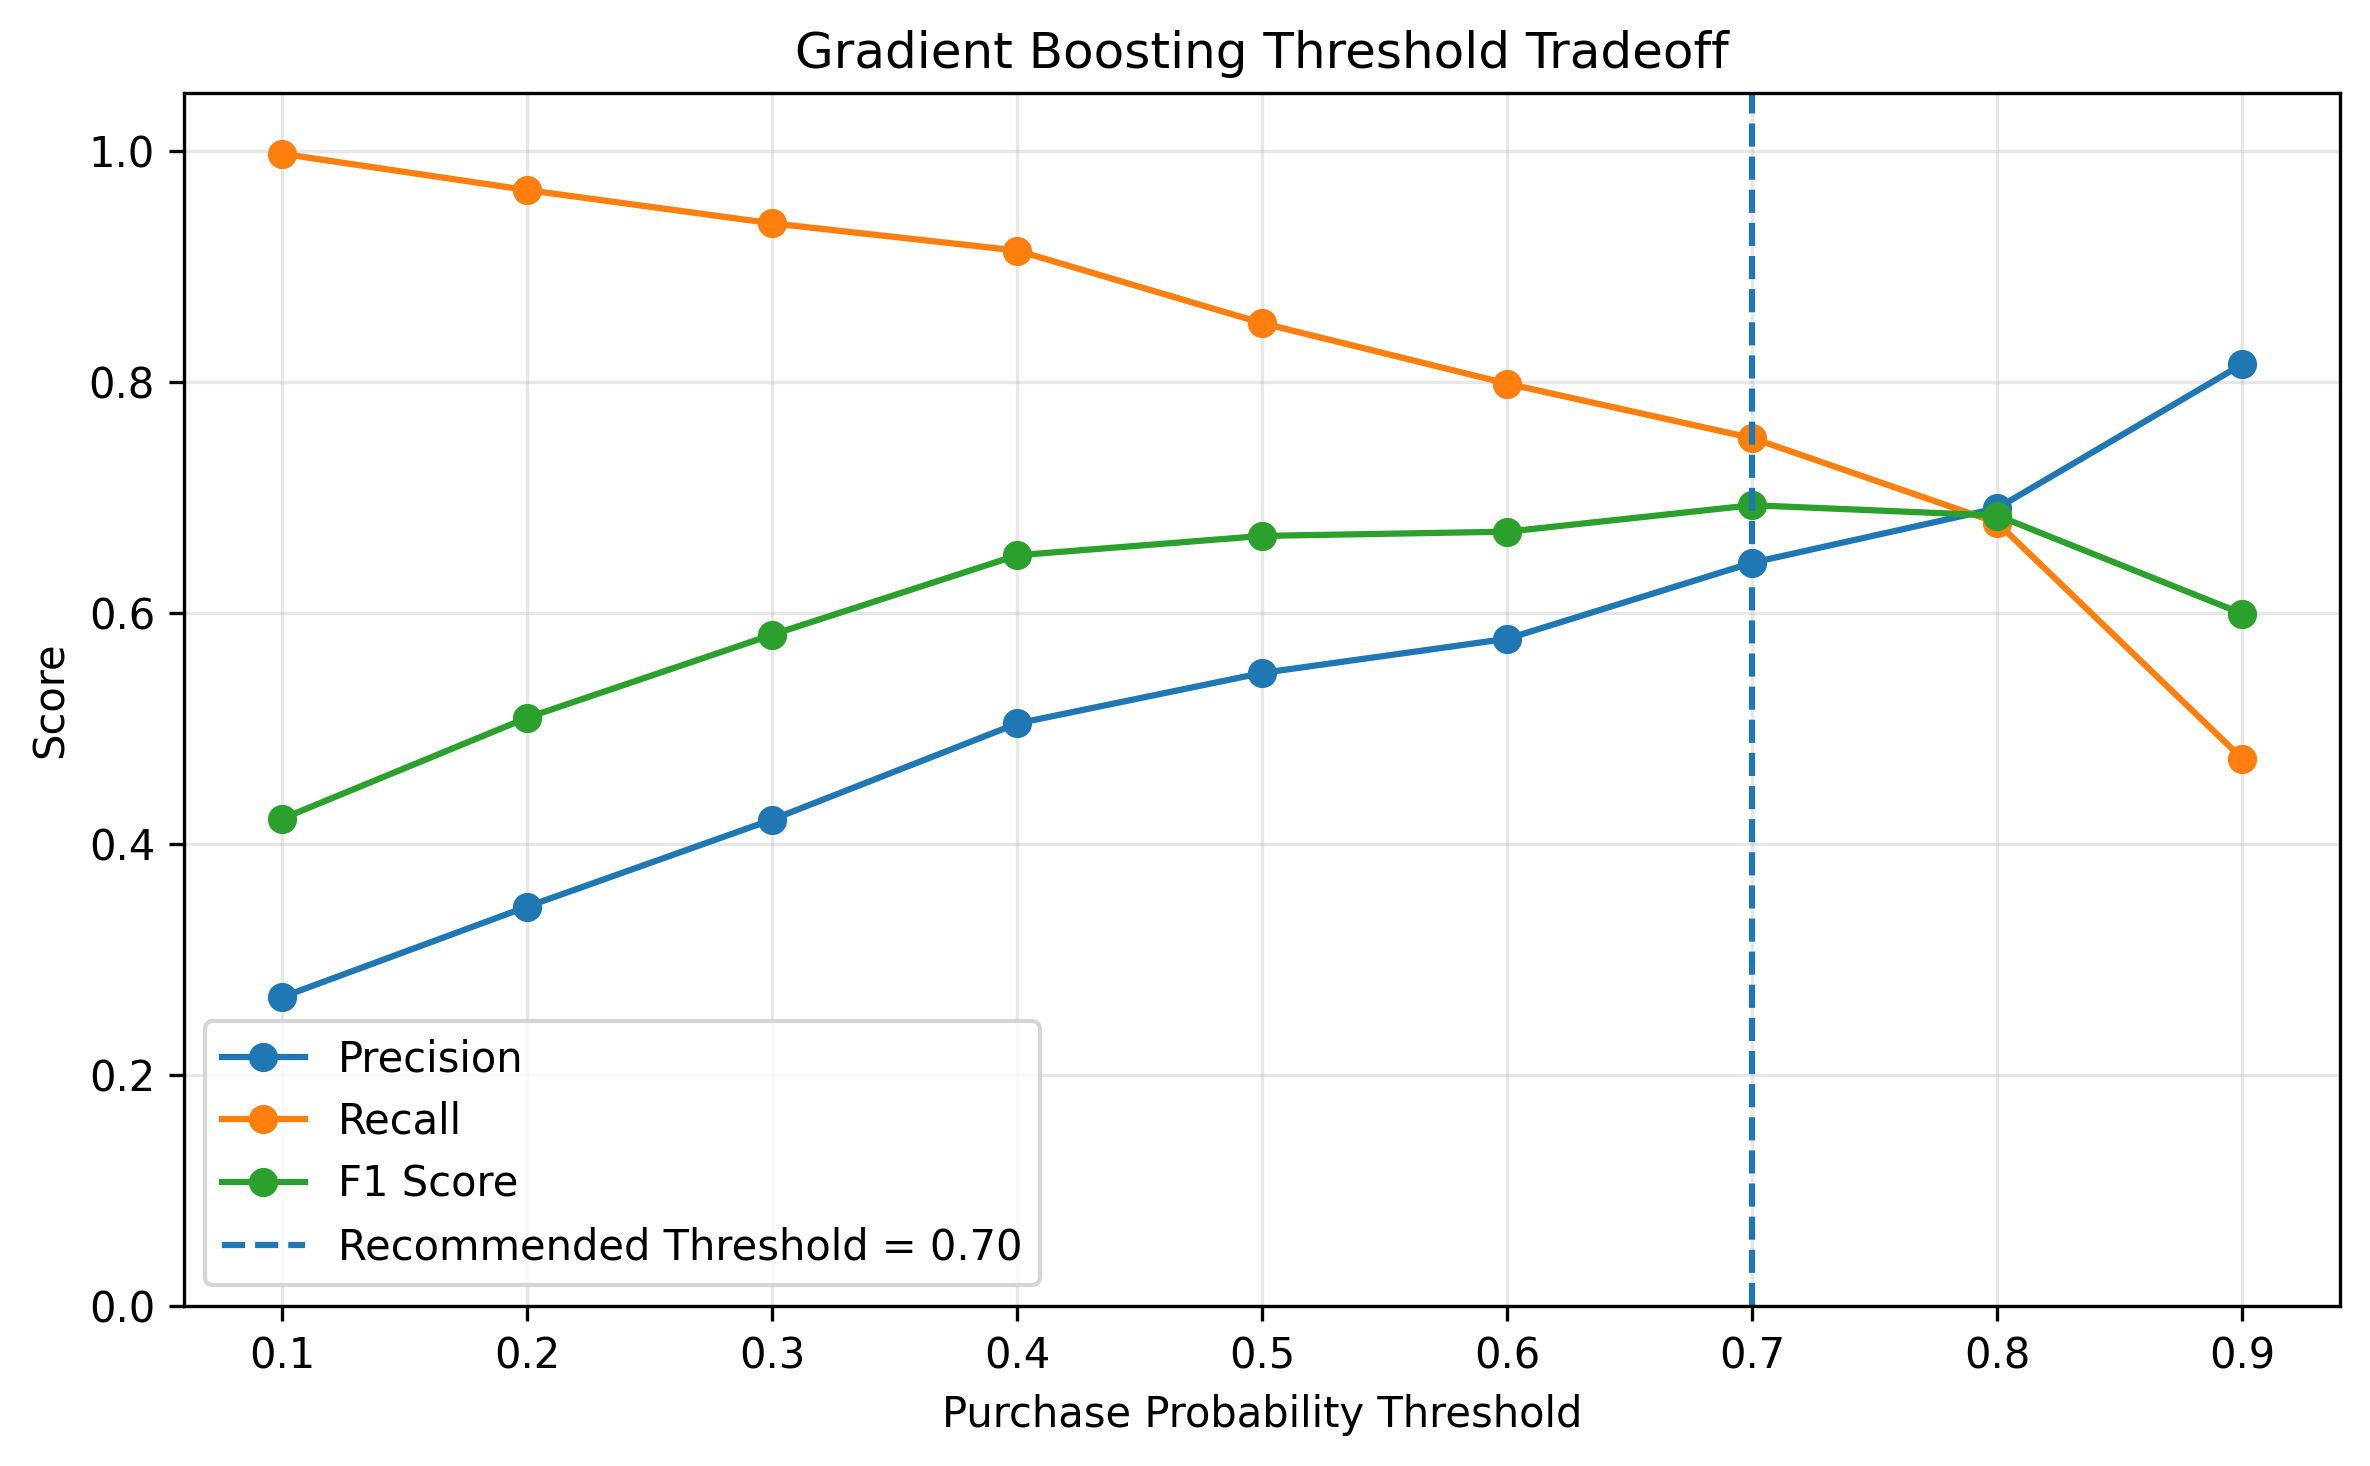
Instead of relying on the default 0.50 classification threshold, the project evaluates multiple probability cutoffs. This is important because conversion modeling is usually a business tradeoff: a lower threshold captures more buyers but may target more non-buyers, while a higher threshold improves confidence but may miss opportunities.
Interpretation
The threshold analysis turns the model from a generic classifier into a business decision tool. A threshold of 0.70 provides the strongest practical balance between identifying purchase-likely sessions and reducing unnecessary targeting of non-purchase sessions.
Feature Signals and Interpretation
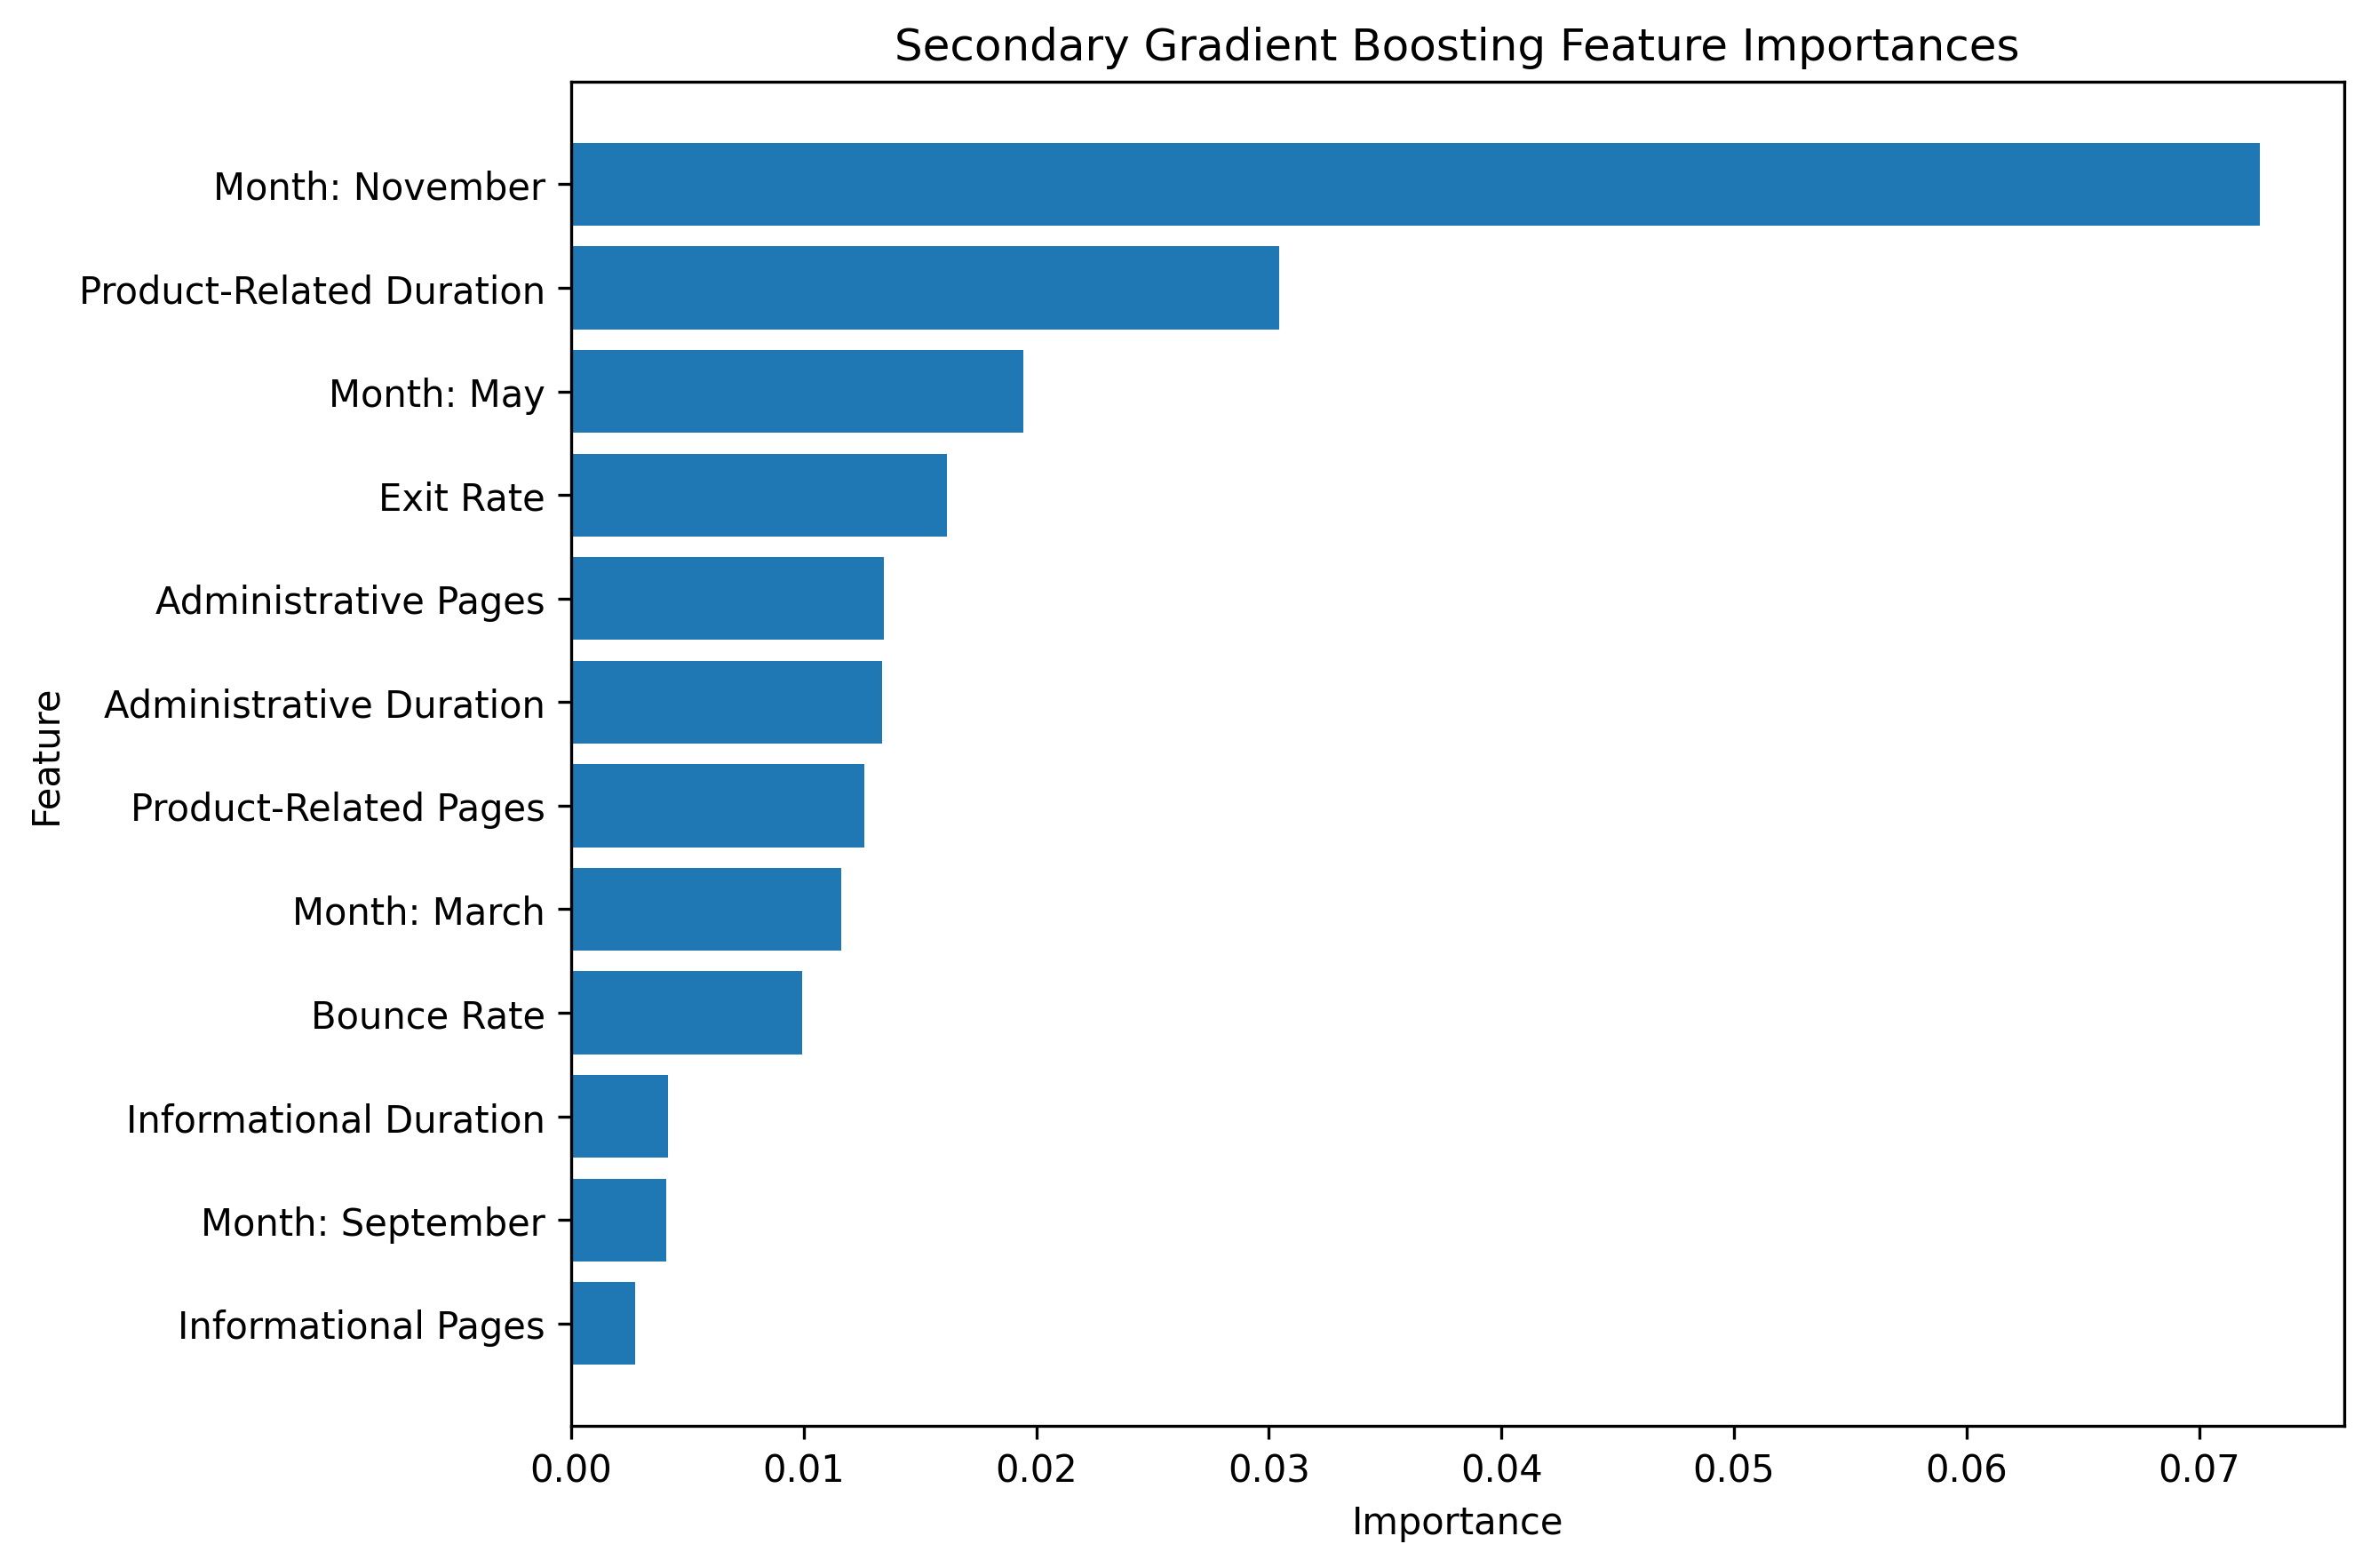
The model interpretation step identifies the behavioral signals that contribute to purchase-likelihood scoring. PageValues was the dominant predictor in the Gradient Boosting model, so this secondary feature-importance view removes it from the chart to reveal additional predictors beyond the strongest single signal.
Role and Implementation
I implemented the full conversion analytics workflow, including data cleaning, exploratory analysis, leakage-safe preprocessing, model comparison, threshold tuning, final model evaluation, and feature-importance interpretation.
Conversion Analysis
Analyzed purchase imbalance, visitor behavior, PageValues dominance, and session-level engagement patterns before modeling.
Predictive Modeling
Compared Logistic Regression, Random Forest, and Gradient Boosting models using a consistent preprocessing pipeline.
Threshold and Evaluation
Tuned the final Gradient Boosting decision threshold and evaluated performance using precision, recall, F1-score, ROC-AUC, and confusion matrices.
Tools
Python • Pandas • NumPy • Matplotlib • Scikit-learn • Seaborn • Jupyter Notebook
Artifacts
The project artifacts include the notebook, source repository, conversion analysis visuals, model evaluation outputs, and interpretation graphics.
GitHub Repository
Source repository containing the notebook, code, visual outputs, and documentation.
Open repository →Notebook
Main Jupyter Notebook covering conversion analysis, model comparison, threshold tuning, and feature interpretation.
customer_purchase_prediction_conversion_analytics.ipynbVisual Outputs
Selected visuals for conversion behavior, feature signal, threshold optimization, final model performance, and secondary feature importance.
images/projects/customer-purchase/